Wind, elevation & rain radar overlays
Wind overlay
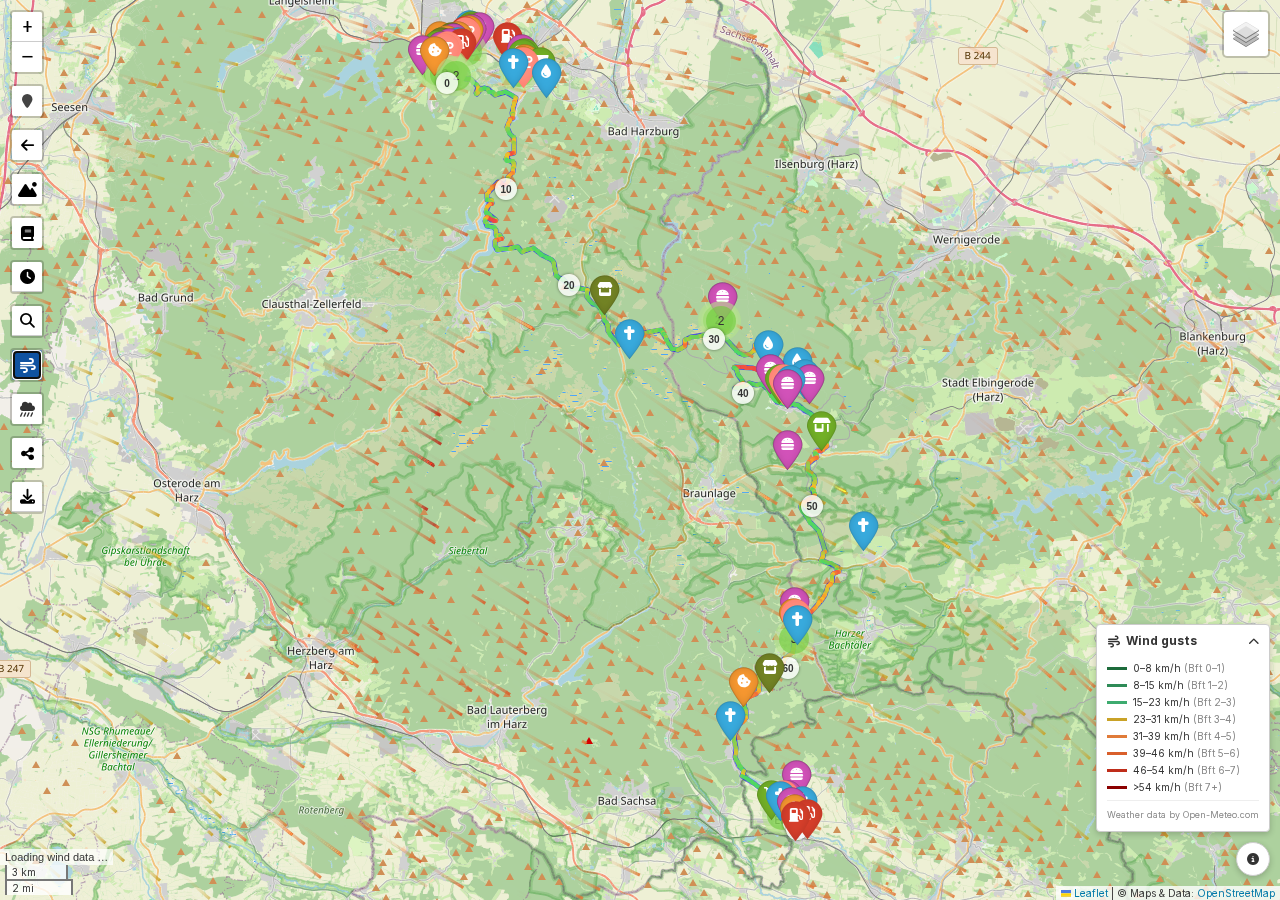
The wind button, top-left, overlays live, animated wind-particle arrows across the map, color-coded by gust speed; it's gusts rather than steady wind, so expect the readout to run a bit higher than a general forecast. It only kicks in from zoom level 10 upward; zoom out further and the button dims, with a tooltip explaining why. Wind data comes from Open-Meteo.
| Speed | Beaufort | |
|---|---|---|
| 0–8 km/h | 0–1 | |
| 8–15 km/h | 1–2 | |
| 15–23 km/h | 2–3 | |
| 23–31 km/h | 3–4 | |
| 31–39 km/h | 4–5 | |
| 39–46 km/h | 5–6 | |
| 46–54 km/h | 6–7 | |
| over 54 km/h | 7+ |
A collapsible legend in the bottom-right corner shows this same scale on the map, click its header to expand or collapse it. While it's active, a small readout in the bottom-left corner shows the current wind direction and speed for the area.
On route maps, turning the wind overlay on also recolors the route itself, from green through amber to red, by how much the wind is helping or hindering you at each point along the way: green for a tailwind, amber for a crosswind, red for a headwind. Hover over the route to see the exact head-/tailwind component in km/h at that spot. The bottom-right legend only covers the particle field's speed scale above; the route coloring doesn't have one of its own, since the gradient is meant to read at a glance and hovering already gives you the precise number.
Elevation / gradient overlay
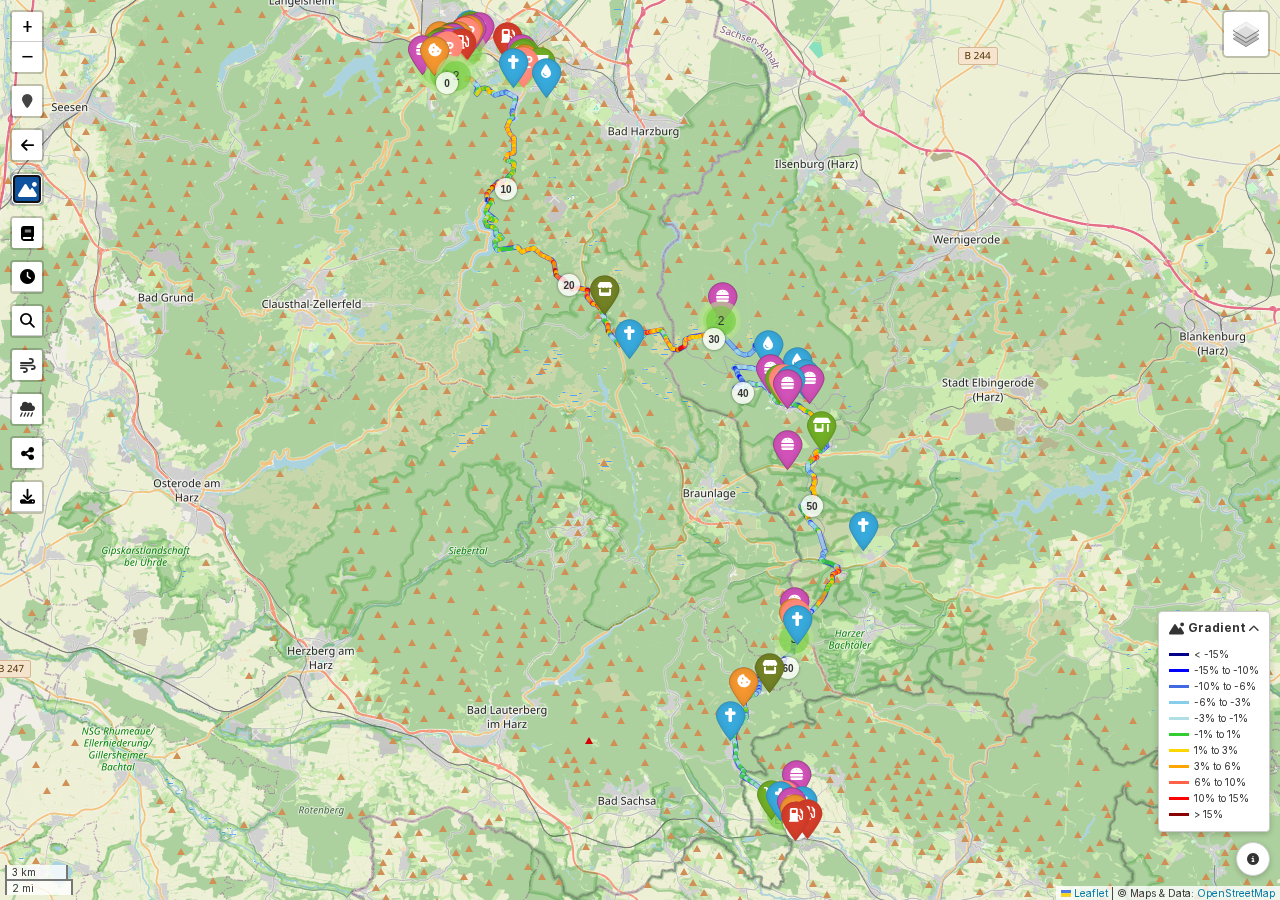
On route maps, the elevation button, also top-left, recolors the track by gradient. Hover over the track to see the exact gradient at that point. If your GPX file doesn't include elevation data, OnRouteMap will just tell you the overlay isn't available for that route.
| Gradient | |
|---|---|
| under -15% | |
| -15% to -10% | |
| -10% to -6% | |
| -6% to -3% | |
| -3% to -1% | |
| -1% to 1% (flat) | |
| 1% to 3% | |
| 3% to 6% | |
| 6% to 10% | |
| 10% to 15% | |
| over 15% |
Downhill sections shade blue, uphill sections shade from gold through orange to red, so a quick glance tells you where the climbs and descents are without reading a single number. Like the wind overlay, the gradient legend in the bottom-right is collapsible.
Note
The wind and elevation overlays both recolor the route itself, so having both on at once would just be confusing. Turning one on automatically turns the other off.
Rain radar overlay
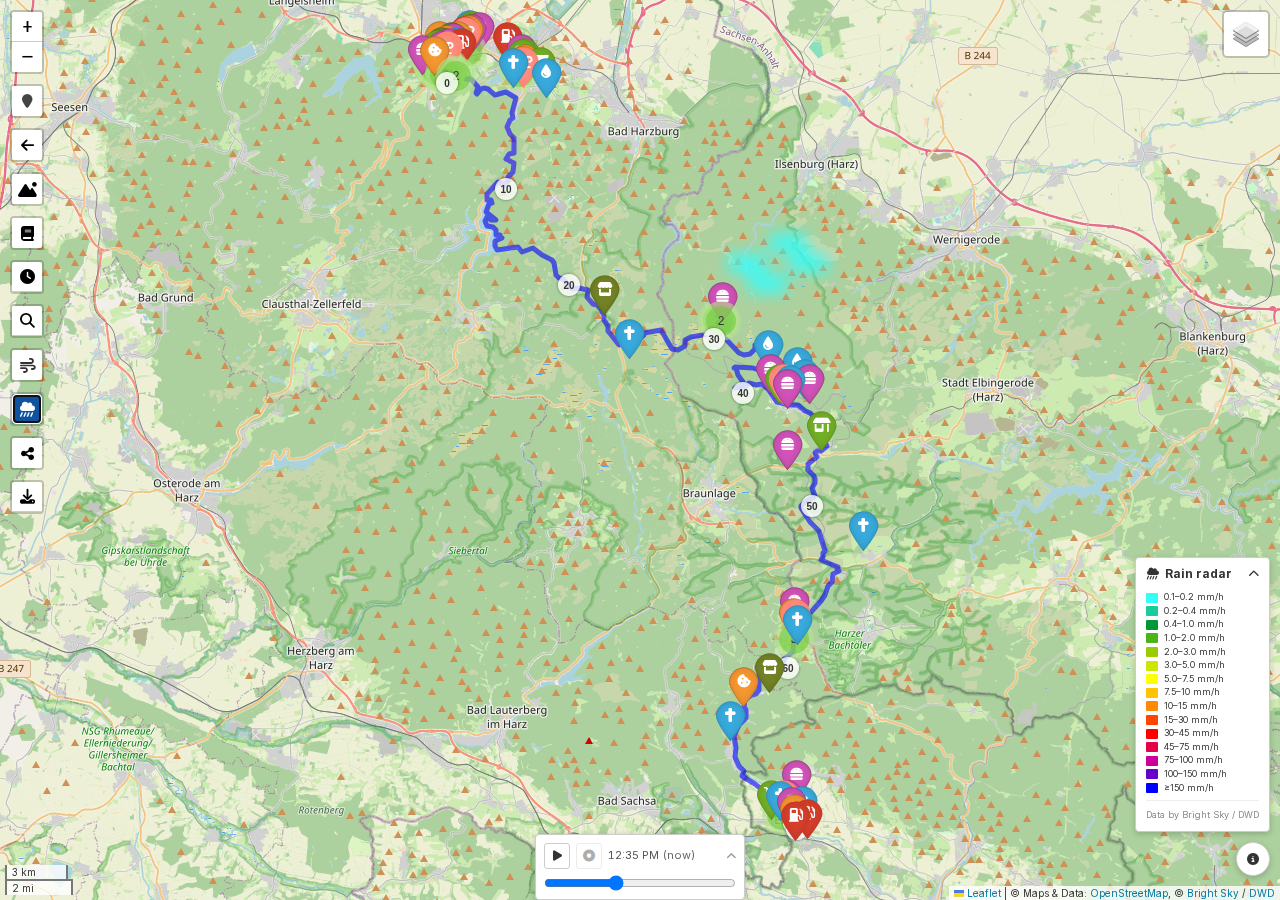
The rain radar button, top-left, overlays an animated view of live precipitation radar from the DWD (Deutscher Wetterdienst, Germany's national weather service): roughly the past hour plus a ~2-hour forecast, sourced from Bright Sky. It only shows up at all if your route or search point is within Germany and its immediate border regions, that's the only area DWD's radar covers, and it can also be switched off site-wide by the operator if the upstream data source is down. Like the wind overlay, it only kicks in from zoom level 10 upward, and it follows the visible part of the map rather than the whole route, so it works the same way on a short ride or a multi-day tour.
A collapsible legend in the bottom-right shows this scale, matching DWD's own official rain-radar legend:
| Intensity | |
|---|---|
| 0.1–0.2 mm/h | |
| 0.2–0.4 mm/h | |
| 0.4–1.0 mm/h | |
| 1.0–2.0 mm/h | |
| 2.0–3.0 mm/h | |
| 3.0–5.0 mm/h | |
| 5.0–7.5 mm/h | |
| 7.5–10 mm/h | |
| 10–15 mm/h | |
| 15–30 mm/h | |
| 30–45 mm/h | |
| 45–75 mm/h | |
| 75–100 mm/h | |
| 100–150 mm/h | |
| 150 mm/h and up |
A playback panel, fixed to the bottom of the screen, lets you play or pause the animation, jump straight back to "now", or drag its slider to scrub through individual frames by hand; a label shows whether the frame on screen is in the past, now, or a forecast. Click the chevron on the panel to collapse it out of the way.
Note
If you pan far away from your route or search point, or outside the covered region entirely, the button explains why the overlay isn't shown instead of just disappearing.